Investor Relations Financial Highlights
Net sales
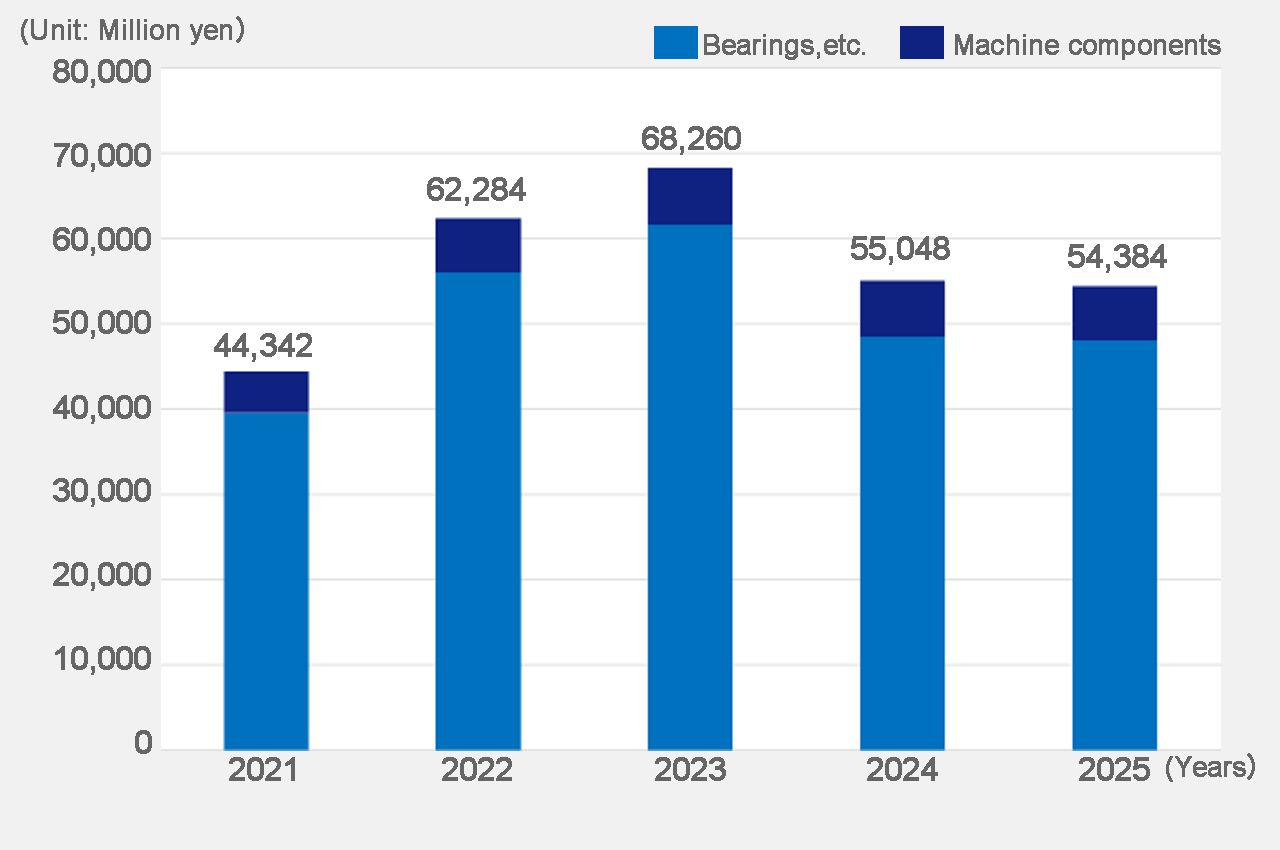
| March 2021 term |
March 2022 term |
March 2023 term |
March 2024 term |
March 2025 term |
|
|---|---|---|---|---|---|
| Bearings, etc. | 39,565 | 55,944 | 61,536 | 48,469 | 47,966 |
| Machine components | 4,776 | 6,340 | 6,723 | 6,579 | 6,417 |
| Total | 44,342 | 62,284 | 68,260 | 55,048 | 54,384 |
Operating profit
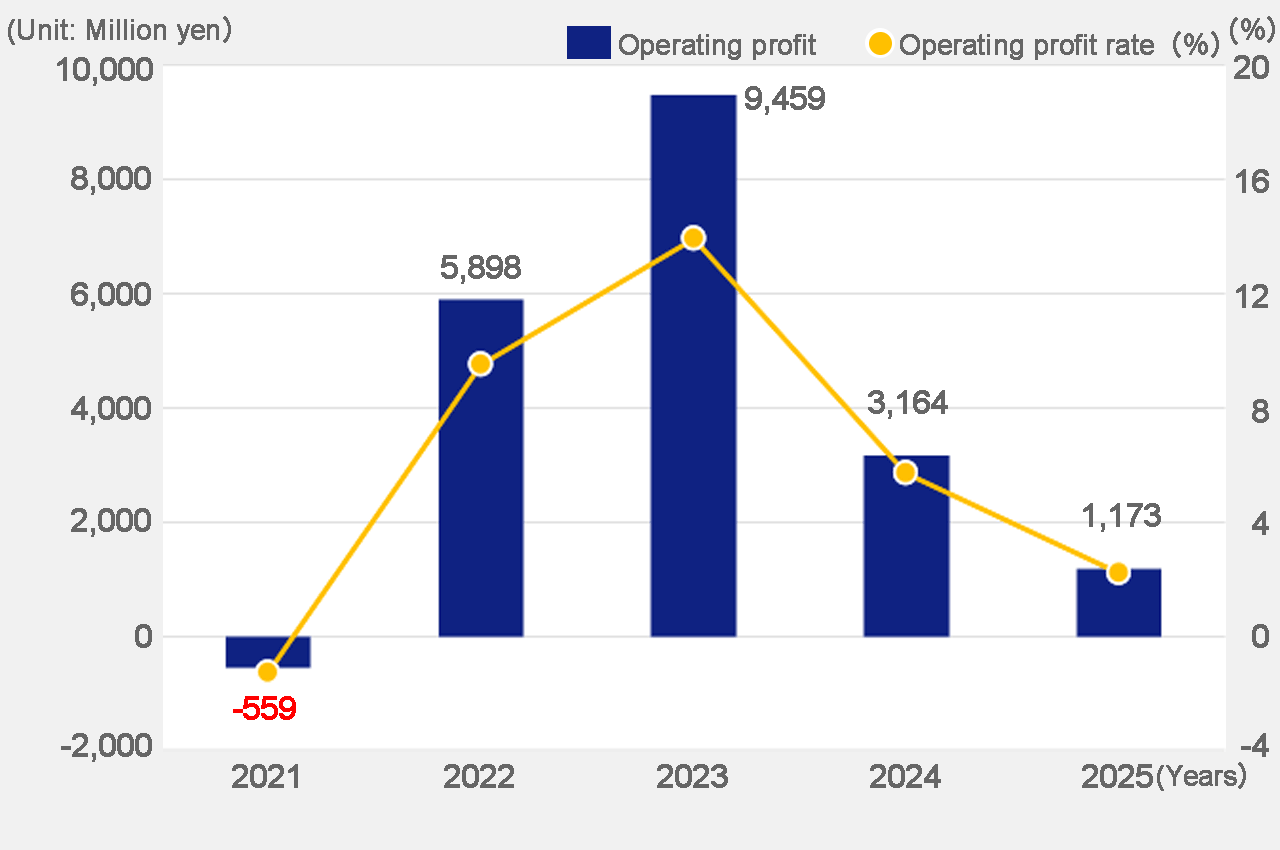
| March 2021 term |
March 2022 term |
March 2023 term |
March 2024 term |
March 2025 term |
|
|---|---|---|---|---|---|
| Operating profit | -559 | 5,898 | 9,459 | 3,164 | 1,173 |
| Operating profit rate | -1.3% | 9.5% | 13.9% | 5.7% | 2.2% |
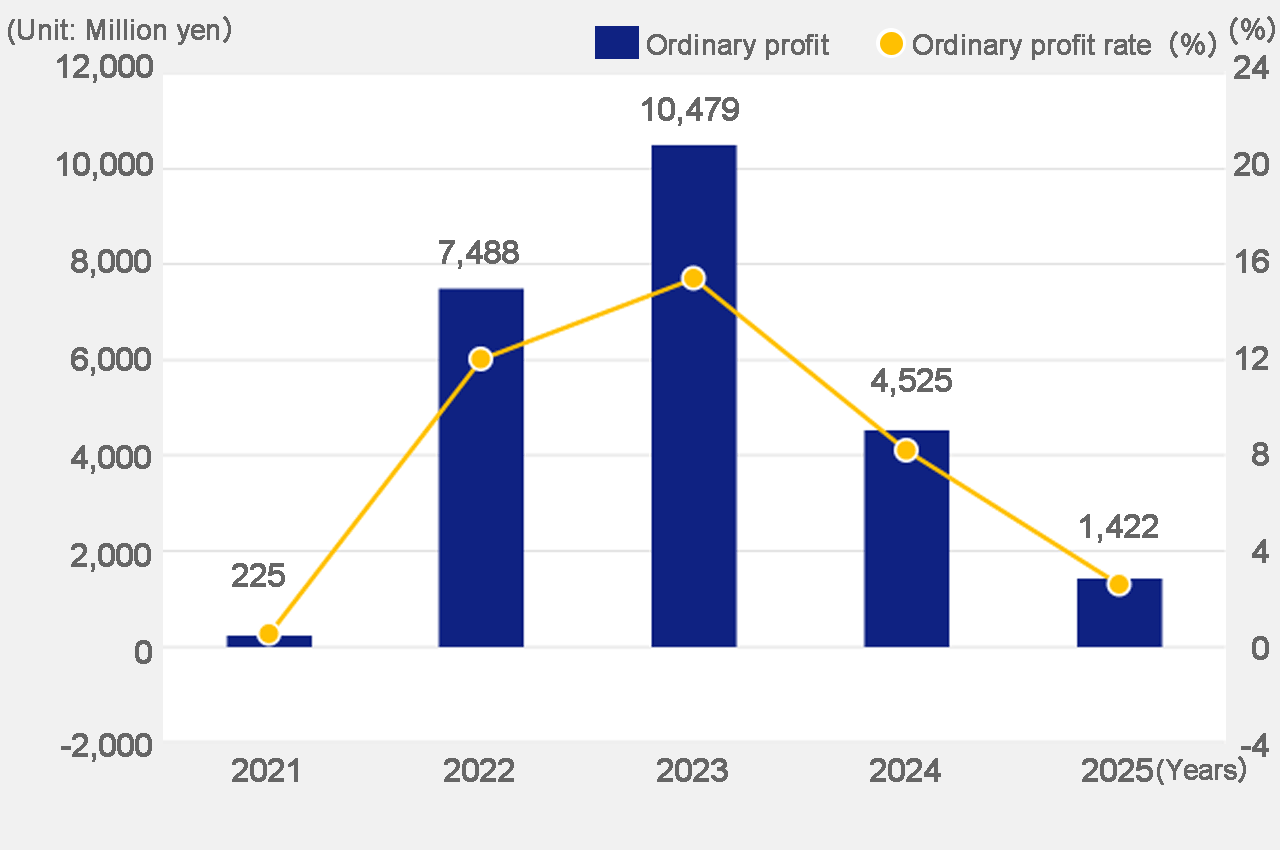
Ordinary profit
| March 2021 term |
March 2022 term |
March 2023 term |
March 2024 term |
March 2025 term |
|
|---|---|---|---|---|---|
| Ordinary profit | 225 | 7,488 | 10,479 | 4,525 | 1,422 |
| Ordinary profit rate | 0.5% | 12.0% | 15.4% | 8.2% | 2.6% |
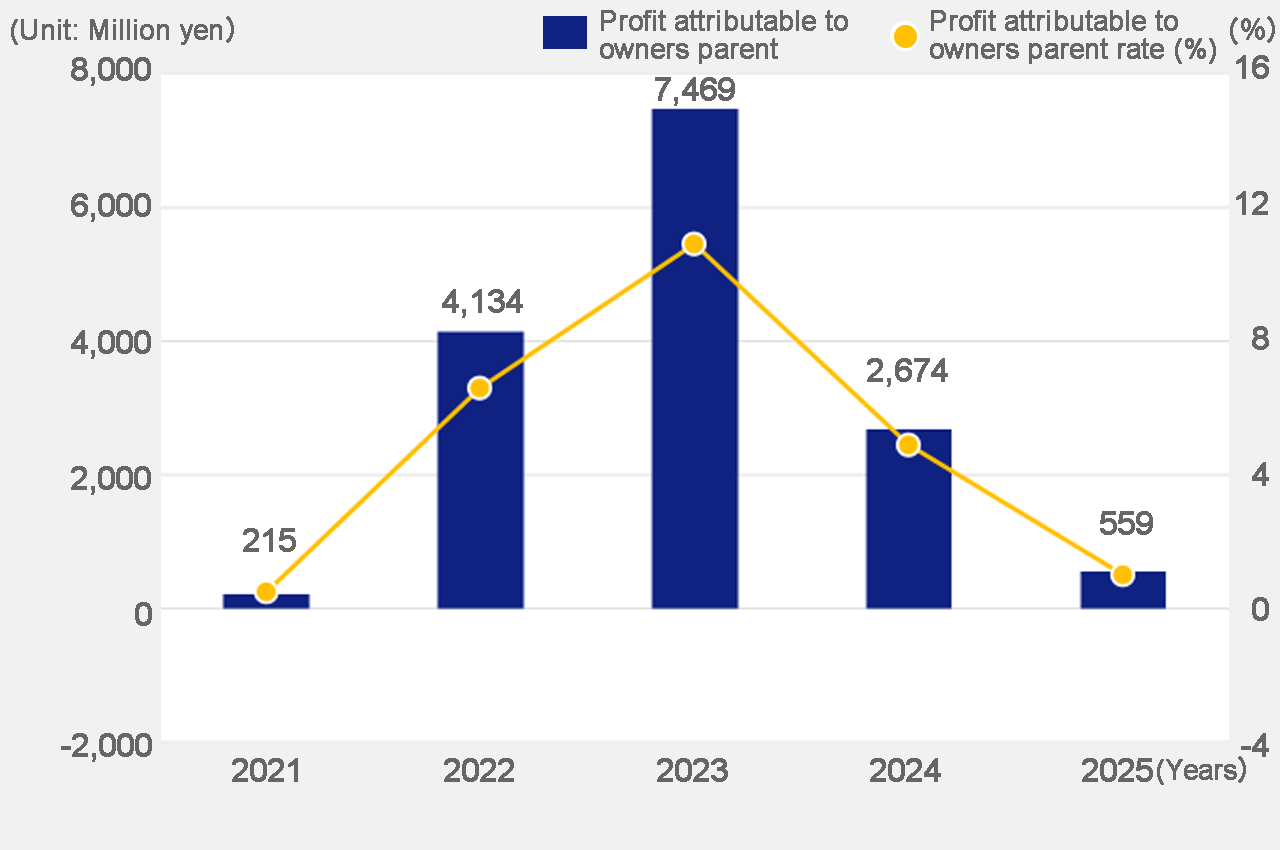
Profit attributable to owners of parent
| March 2021 term |
March 2022 term |
March 2023 term |
March 2024 term |
March 2025 term |
|
|---|---|---|---|---|---|
| Profit attributable to owners of parent |
215 | 4,134 | 7,469 | 2,674 | 559 |
| Profit attributable to owners of parent rate |
0.5% | 6.6% | 10.9% | 4.9% | 1.0% |
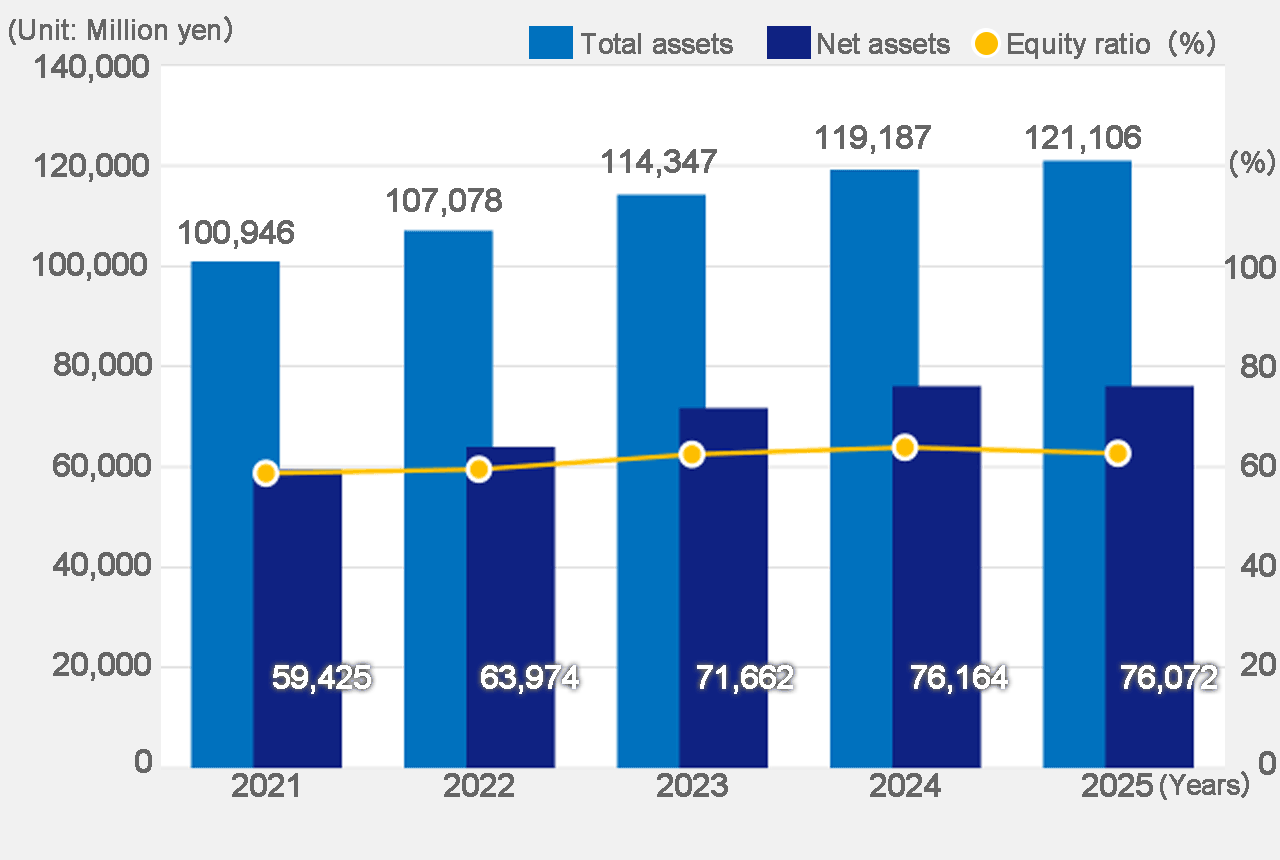
Total assets/net assets and equity ratio
| March 2021 term |
March 2022 term |
March 2023 term |
March 2024 term |
March 2025 term |
|
|---|---|---|---|---|---|
| Total assets | 100,946 | 107,078 | 114,347 | 119,187 | 121,106 |
| Net assets | 59,425 | 63,974 | 71,662 | 76,164 | 76,072 |
| Equity ratio | 58.7% | 59.6% | 62.6% | 63.8% | 62.7% |
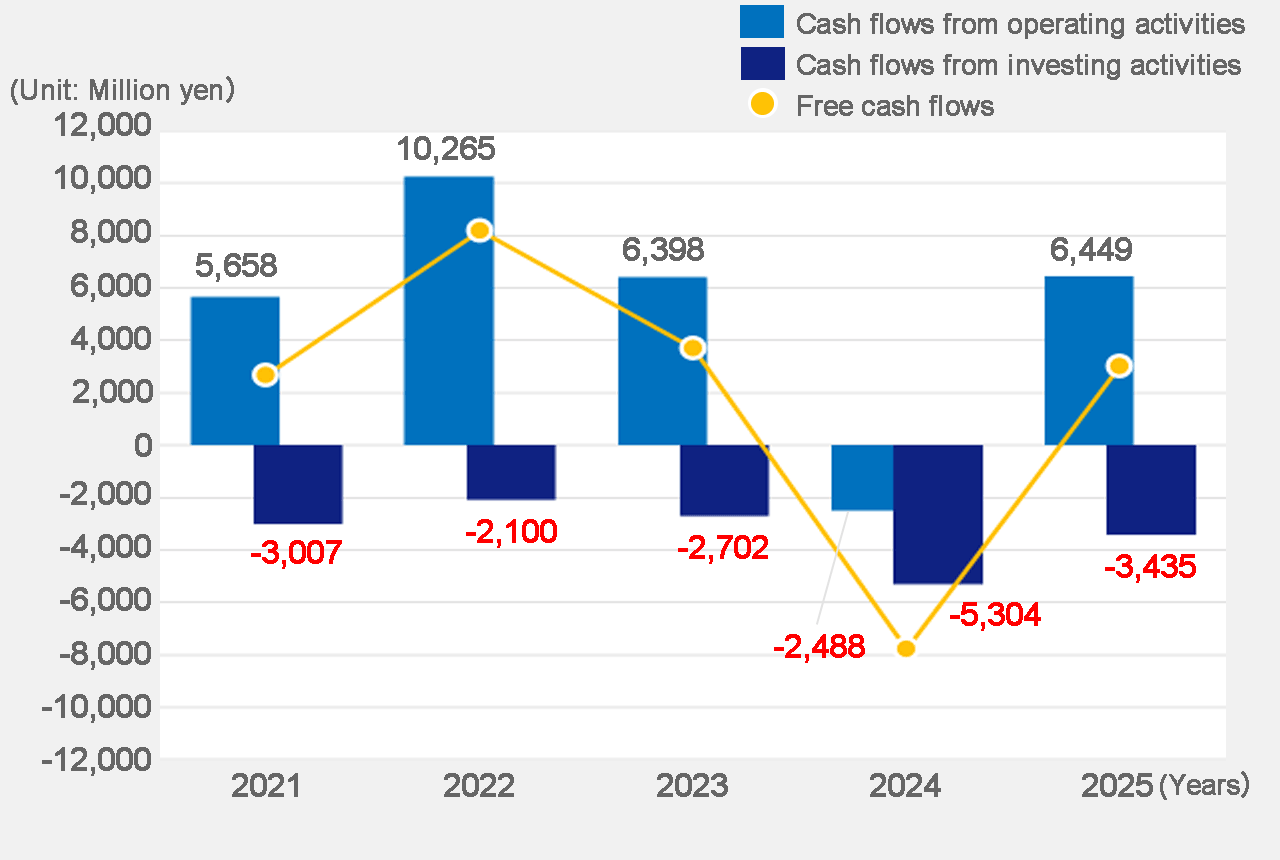
Cash flows
| March 2021 term |
March 2022 term |
March 2023 term |
March 2024 term |
March 2025 term |
|
|---|---|---|---|---|---|
| Cash flows from operating activities |
5,658 | 10,265 | 6,398 | -2,488 | 6,449 |
| Cash flows from investing activities |
-3,007 | -2,100 | -2,702 | -5,304 | -3,435 |
| Free cash flows※ | 2,650 | 8,165 | 3,696 | -7,792 | 3,014 |
※Free cash flows are the total cash flows from operating activities and investing activities.
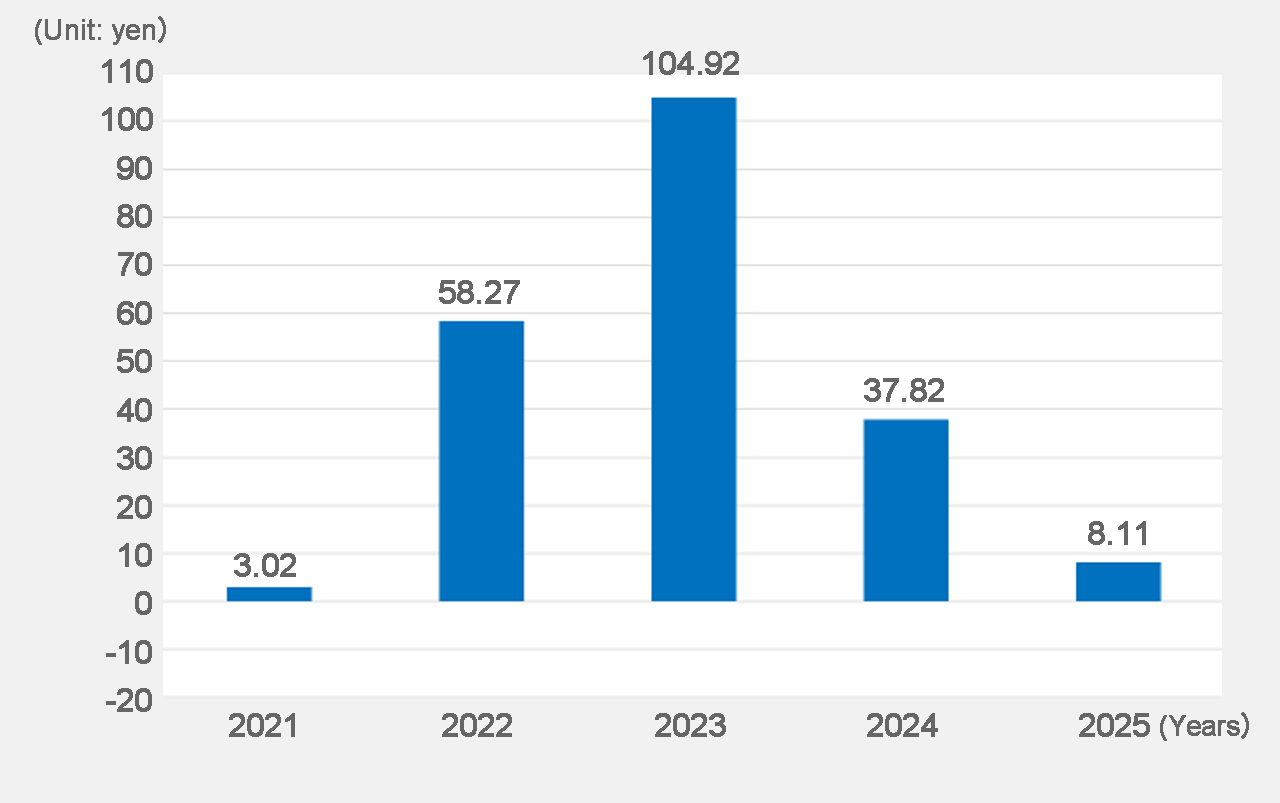
Net income per share
| March 2021 term |
March 2022 term |
March 2023 term |
March 2024 term |
March 2025 term |
|
|---|---|---|---|---|---|
| Net income per share |
3.02 | 58.27 | 104.92 | 37.82 | 8.11 |
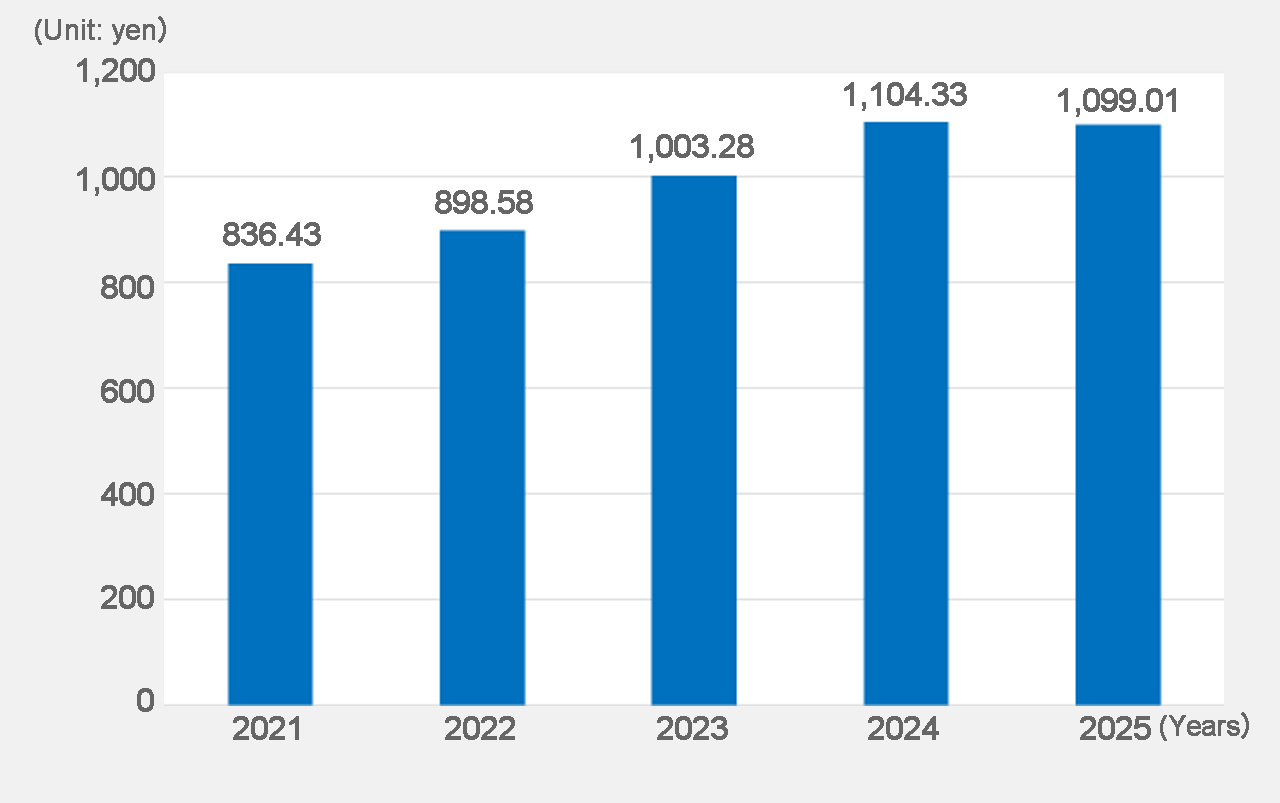
Net assets per share
| March 2021 term |
March 2022 term |
March 2023 term |
March 2024 term |
March 2025 term |
|
|---|---|---|---|---|---|
| Net assets per share |
836.43 | 898.58 | 1,003.28 | 1,104.33 | 1,099.01 |
